The Search Operations Catalog
The integrative practice: relevance tuning, query-log analysis, zero-result handling, judgment lists, running a search team.
About This Catalog
This is Volume 6 of the Search Engineering Series, covering search operations — the day-to-day practice of running production search systems. Volumes 1–5 documented the technical disciplines: architectures, query understanding, indexing, ranking, evaluation. This volume documents the working methodology that integrates those disciplines into practice. Operations is where the patterns from the prior volumes meet production traffic, where regressions get detected and investigated, where tunings get proposed and tested, where the search system either improves week-over-week or silently degrades.
The volume's perspective. Search engineering is often documented as a set of technical methods — retrieval algorithms, ranking models, indexing patterns. The methods are foundational, but they don't describe what a search engineer does on a Tuesday morning. The Tuesday-morning work is: review the weekly metrics dashboard, find a regression flagged on Sunday, investigate the production logs, identify that a tokenization change last week affects 3% of queries, prepare a fix, run an A/B test, ship if validated. The work is iterative, evidence-driven, and structured around the same patterns repeated across many decisions. This volume catalogues those patterns.
Why operations is the integrative volume. Each prior volume covers one technical discipline. Operations consumes them all daily. A regression alert prompts investigation that may trace back to Volume 2 (the query understanding produced a different intent class than expected), Volume 3 (a recent reindex changed tokenization), Volume 4 (the ranking model picked up a new feature with unstable values), or Volume 5 (the evaluation methodology is producing inconsistent measurements). The operational discipline is fluent traversal of the five technical volumes, with the practical experience to know where to look first.
Scope
Coverage:
- Query log analysis: collecting, enriching, aggregating production query data; the analytics that drive operational decisions.
- Zero-result and low-CTR query investigation: the most common operational signals; the methodology for tracing them through the pipeline to root causes.
- Regression detection and alerting: the metrics worth tracking, the alert thresholds, the response patterns.
- Root cause analysis: the diagnostic methodology for moving from "something is wrong" to "this specific change in this specific component caused it."
- A/B testing operations: power calculation, ramping, analysis, decision-making for search changes.
- Index health monitoring: ensuring the index is operating correctly day-to-day.
- Tuning cadence and prioritization: how the team allocates effort across the many possible improvements.
- Production incident response: when search breaks, the patterns for diagnosing and recovering.
Out of scope (covered in other volumes):
- The technical methods themselves. Volumes 1–5 cover.
- Search UX patterns. Planned Volume 7.
- Platform-specific operational tooling. Planned Volume 8.
- Generic site reliability engineering and observability. Outside scope; covered in SRE literature.
- ML model lifecycle management beyond search. Outside scope; covered in MLOps literature.
How to read this catalog
Part 1 ("The Narratives") is conceptual orientation: what operations is and where it sits; query log analysis as the data foundation; zero-result and low-CTR investigation as the dominant signal patterns; regression detection and root cause analysis; tuning cadence and the iteration discipline. Five diagrams sit in Part 1.
Part 2 ("The Substrates") is the pattern reference, organized by section. Each section opens with a short essay on what its patterns share. Representative patterns appear in the Fowler-style template with concrete artifacts (SQL queries, monitoring configurations, alerting setups) for the central methods.
Part 1 — The Narratives
Five short essays orient the reader to search operations as engineering discipline. The reference entries in Part 2 assume the vocabulary established here.
Chapter 1. What Search Operations Is
Search operations is the discipline of running search in production. The work is iterative — the system doesn't stay good without continuous attention. The work is evidence-driven — changes are proposed based on observed signals from production traffic, not based on intuition. The work is integrative — it touches every other discipline in the series. The work is mostly invisible to people outside the team — the team's success is search that doesn't generate complaints, and search that quietly improves over time.
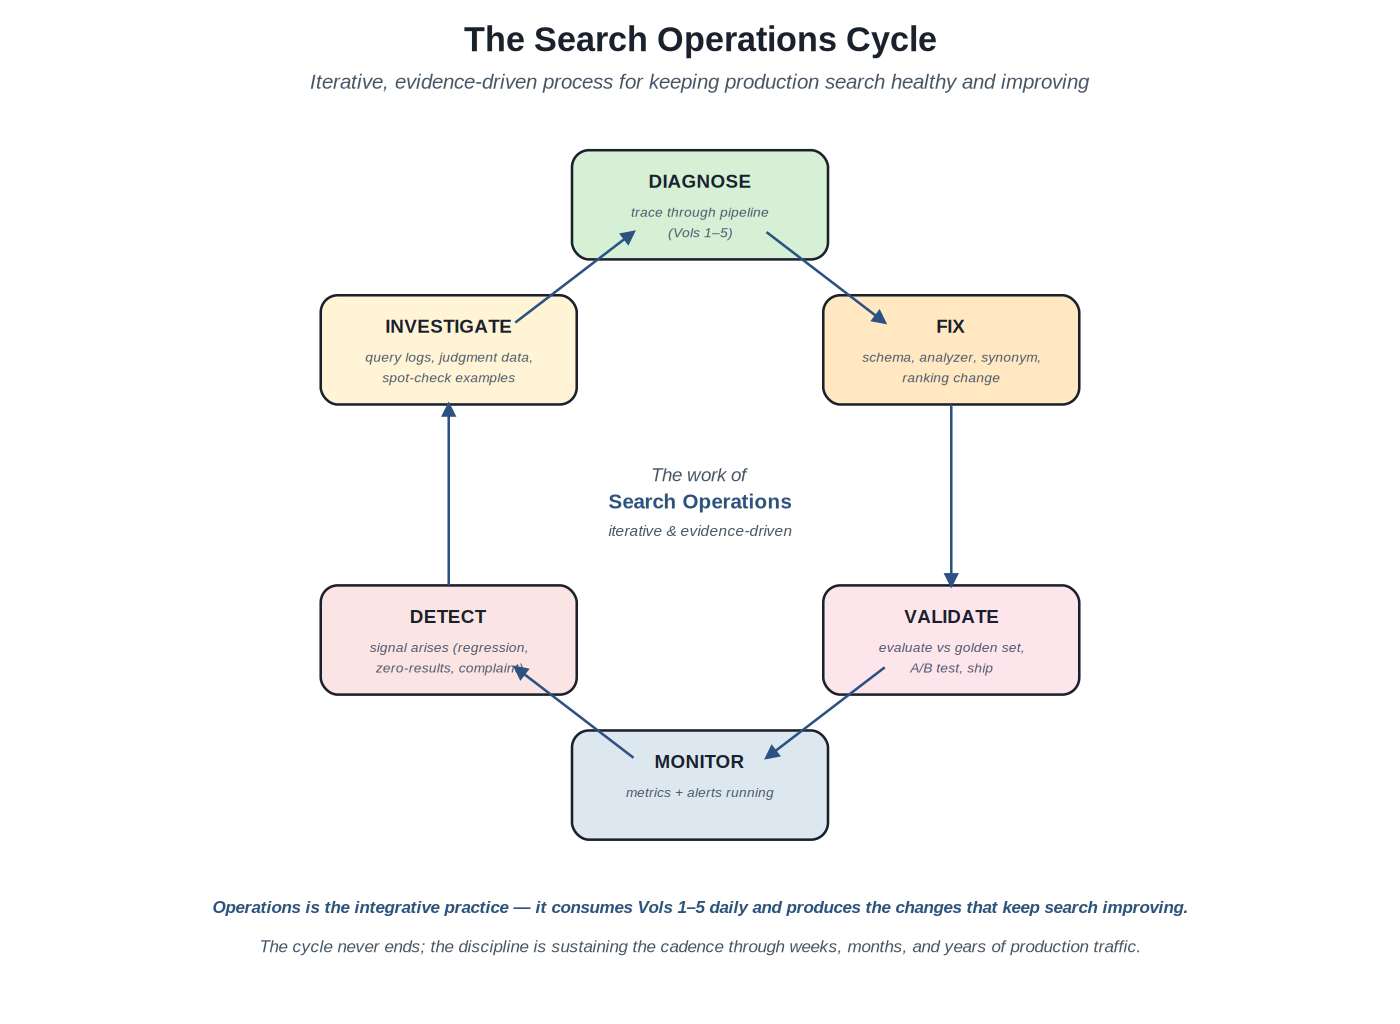
The iterative cycle: monitor, detect, investigate, diagnose, fix, validate. The cycle never ends; the discipline is sustaining the cadence.
The cycle. The work proceeds in a loop. Metrics and alerts run continuously (monitor); something arises that warrants attention — a regression alert, a user complaint, a zero-result spike, a planned tuning opportunity (detect); the engineer investigates by looking at query logs, judgment data, spot-checking specific queries (investigate); the investigation traces the issue through the search pipeline to a specific component (diagnose); a change is prepared in that component (fix); the change is validated against the judgment set, run through an A/B test, and shipped if it holds up (validate); monitoring continues. The cycle never ends. The team that maintains the cycle sees their search system improve quarter-over-quarter; the team that lets the cycle lapse sees their search system silently degrade.
The discipline is sustaining the cadence. The technical methods documented in Volumes 1–5 are well-understood; what separates effective production search teams from struggling ones is rarely a lack of technical knowledge. It's usually the operational cadence. A team that runs the cycle weekly produces a steady stream of improvements; a team that runs it occasionally accumulates technical debt and gradual quality decline. The operational discipline is structural: dedicated time for the work, dedicated infrastructure (query log pipelines, metrics dashboards, A/B testing platform), dedicated people who own the discipline.
Where operations fits in the broader search engineering practice. Volumes 1–5 provide the vocabulary and the methods. Volume 5 specifically provides the measurement infrastructure that operations consumes — NDCG@K, MRR, judgment data, A/B testing. Volume 4 provides the ranking methods that operations tunes. Volumes 2 and 3 provide the query and document processing that operations diagnoses. Volume 1 provides the architectural framing. Operations sits at the center: it can't function without the others, and the others don't produce sustained value without it.
Operations as the discipline that prevents regression. Production search systems decay if left untended. Content drifts (new product categories appear; old ones retire); user vocabulary drifts (new slang, new acronyms, new terms come into use); the underlying engine receives upgrades that may change behavior subtly; ranking models drift as the underlying data shifts. Operations is the discipline that catches these drifts early and corrects them. Without operations, the system's quality at any point reflects mostly what the team did when they last attended to it, not what the team is doing now.
Chapter 2. Query Log Analysis
The query log is the foundation of operations. Everything the team knows about how the search system is performing in production comes from analyzing query data: which queries were issued, what results came back, what users clicked, what they did afterward. Without query log analysis, the team is operating on speculation. With it, the team has evidence.
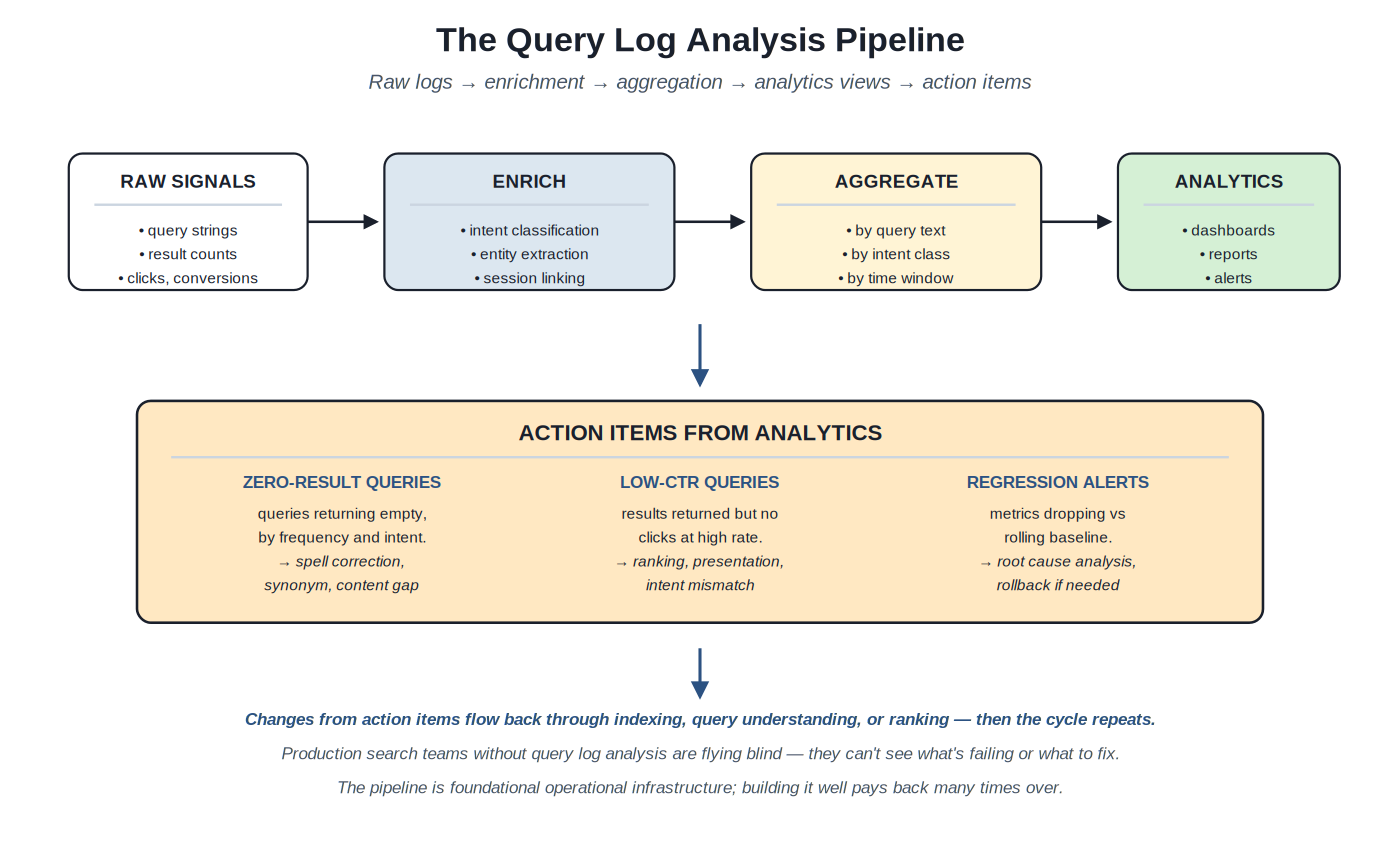
Raw query and behavior signals flow through enrichment and aggregation to analytics views that drive operational action items.
Raw signal collection. The query log captures, for each query: the query string as the user typed it; the timestamp; the user ID or session ID (if available); the query understanding output (intent class, entities, expanded terms); the retrieval output (number of results returned, top result IDs); the ranking output (final ordered list); subsequent user behavior (which results were clicked, whether the user reformulated, whether they purchased or completed a downstream action). The log is voluminous; production teams typically capture hundreds of millions of query events per day for major consumer search systems and many millions even for moderate-scale enterprise systems.
Enrichment. Raw query events need enrichment to be useful. Enrichments include: intent classification (Volume 2 Section D output); entity extraction (Volume 2 Section E output); session linking (grouping queries from the same user session); reformulation detection (which queries are reformulations of earlier ones in the session); outcome attribution (did the session lead to a conversion?). The enrichments turn raw events into a queryable analytical dataset; without them, the analytics that follow are limited.
Aggregation. Enriched query events get aggregated for analysis. By query text: how many times was each unique query issued? By intent class: how does the distribution of intents change over time? By time window: are there daily or weekly patterns? By user segment: do logged-in users behave differently from anonymous? Aggregation produces the data that drives operational dashboards and reports.
Analytics views. The aggregated data feeds specific analytical views: zero-result queries (queries that returned no results, sorted by frequency); low-CTR queries (queries with high impressions but low click-through); high-reformulation queries (queries that users frequently follow up on with a different query, suggesting the first attempt failed); deep-pagination queries (queries where users scroll past the first page, suggesting top results aren't satisfying); regression alerts (metrics drifting from rolling baselines). Each view drives specific operational action.
From analytics to action. The analytics views surface signals; the operational work is converting signals into improvements. A zero-result query at high frequency drives investigation: is it misspelled? Is it a vocabulary gap? Is it a genuine content gap? The investigation methodology (Chapter 3) traces it to a specific component; the fix happens in that component's domain (Vols 2, 3, 4); the fix is validated (Vol 5) and shipped. The loop — from analytics to action and back to analytics — is the substance of operations.
Infrastructure considerations. Query log pipelines are non-trivial infrastructure. They typically involve: a streaming layer (Kafka or equivalent) to capture events without affecting query latency; a data lake or warehouse for long-term storage and analytics; an analytics engine (often a data warehouse like BigQuery, Snowflake, Redshift, or an OLAP engine like ClickHouse) for ad-hoc queries; a dashboard layer for routine views. The infrastructure is shared with broader product analytics in most companies; the search team's job is making sure search-specific dimensions are captured and surfacing search-specific views on top.
Chapter 3. Zero-Result and Low-CTR Investigation
Zero-result queries and low-CTR queries are the dominant operational signals. Zero-result means the system returned nothing for a query — an unambiguous failure that the user experiences as the search system breaking. Low-CTR means the system returned results but users didn't click them — the system technically worked but didn't satisfy the user. Both signals appear in query logs at scale; investigating them is the bread-and-butter operational work.
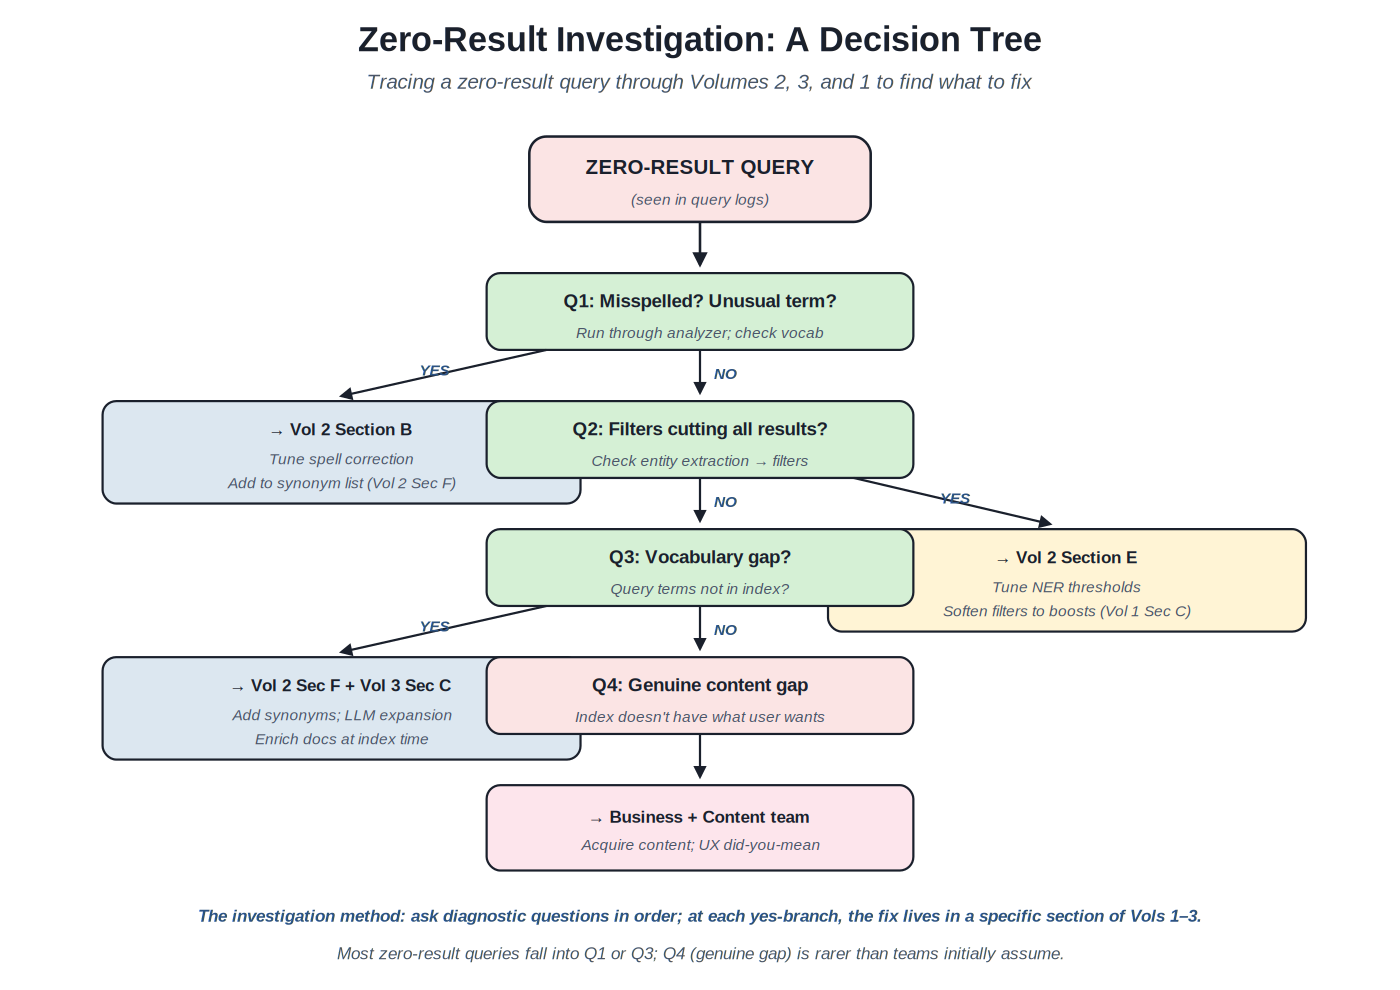
The diagnostic method: ask diagnostic questions in order; at each yes-branch, the fix lives in a specific section of Vols 1–3.
The zero-result investigation method. The diagnostic tree (Figure 3) walks through diagnostic questions in order, each pointing to a specific section of the prior volumes where the fix lives. Q1 is the most common: is the query misspelled or using an unusual term? Most zero-result queries from typical e-commerce traffic are misspellings; Volume 2 Section B (spell correction) catches them. Q2 covers a subtler case: filters from entity extraction ("nike" as brand filter when entity recognition misfires on a generic query) cutting all results; Volume 2 Section E plus Volume 1 Section C handle. Q3 covers vocabulary gaps: the user said "sneakers" and the index says "running shoes"; Volume 2 Section F (synonyms) and Volume 3 Section C (document enrichment) handle. Q4 is the rarest case: genuine content gap; the fix is content acquisition, which is a business problem rather than an engineering one.
Why the order matters. The tree is ordered by frequency and ease. Q1 catches the largest share of zero-result queries; the fixes (spell correction tuning, synonym additions) are quick and cheap. Q4 is rare and the fix is expensive (acquiring new content). Production teams work top-down: handle the cheap, frequent cases first; investigate the expensive, rare cases when the cheap cases are exhausted. The discipline is resisting the temptation to assume Q4 immediately when Q1 is the actual cause.
Low-CTR investigation. The investigation pattern is similar but the diagnostic questions are different. Q1 for low-CTR: is the query understanding producing wrong intent or wrong entities? Misclassification routes the query to inappropriate retrieval, which retrieves poor results. Q2: is retrieval finding relevant documents but ranking is misordering them? The judgment set (Volume 5 Section A) reveals whether retrieval has good candidates that ranking is suppressing. Q3: is the presentation suppressing clicks? Snippets, titles, or display issues can make relevant results invisible to users. Q4: are the results genuinely relevant but not what the user wanted? Intent mismatch may need UX clarification (the future Volume 7 covers).
The investigation as routine work. These investigations are not occasional special projects; they're routine operational work. Mature teams investigate the top 20–50 zero-result and low-CTR queries every week, generating a steady stream of small fixes. The fixes individually are modest, but they compound: a year of weekly investigations produces hundreds of synonym additions, dozens of spell-correction improvements, many ranking adjustments. The cumulative effect on search quality is substantial; the per-week effort is sustainable.
Prioritization. Not every zero-result or low-CTR query deserves investigation. Frequency matters: a zero-result query issued once in a quarter is less worth fixing than one issued thousands of times per day. Business value matters: a zero-result query for a high-margin product category is more valuable to fix than one for a low-margin category. Investigation effort matters: a query that's easy to diagnose and fix is higher priority than one that would require a major project. Production teams typically rank investigations by frequency × business value, with effort estimates informing the ordering of work.
Chapter 4. Regression Detection and Root Cause
Regressions are quality drops in production search. They happen — deployments introduce bugs; data pipeline changes affect indexing; embedding model updates shift retrieval behavior; ranking model retraining picks up new patterns that aren't universally good. Production teams without regression detection learn about quality drops from user complaints, by which time damage is done. Production teams with regression detection learn from metrics, often before users notice, and can investigate and fix proactively.
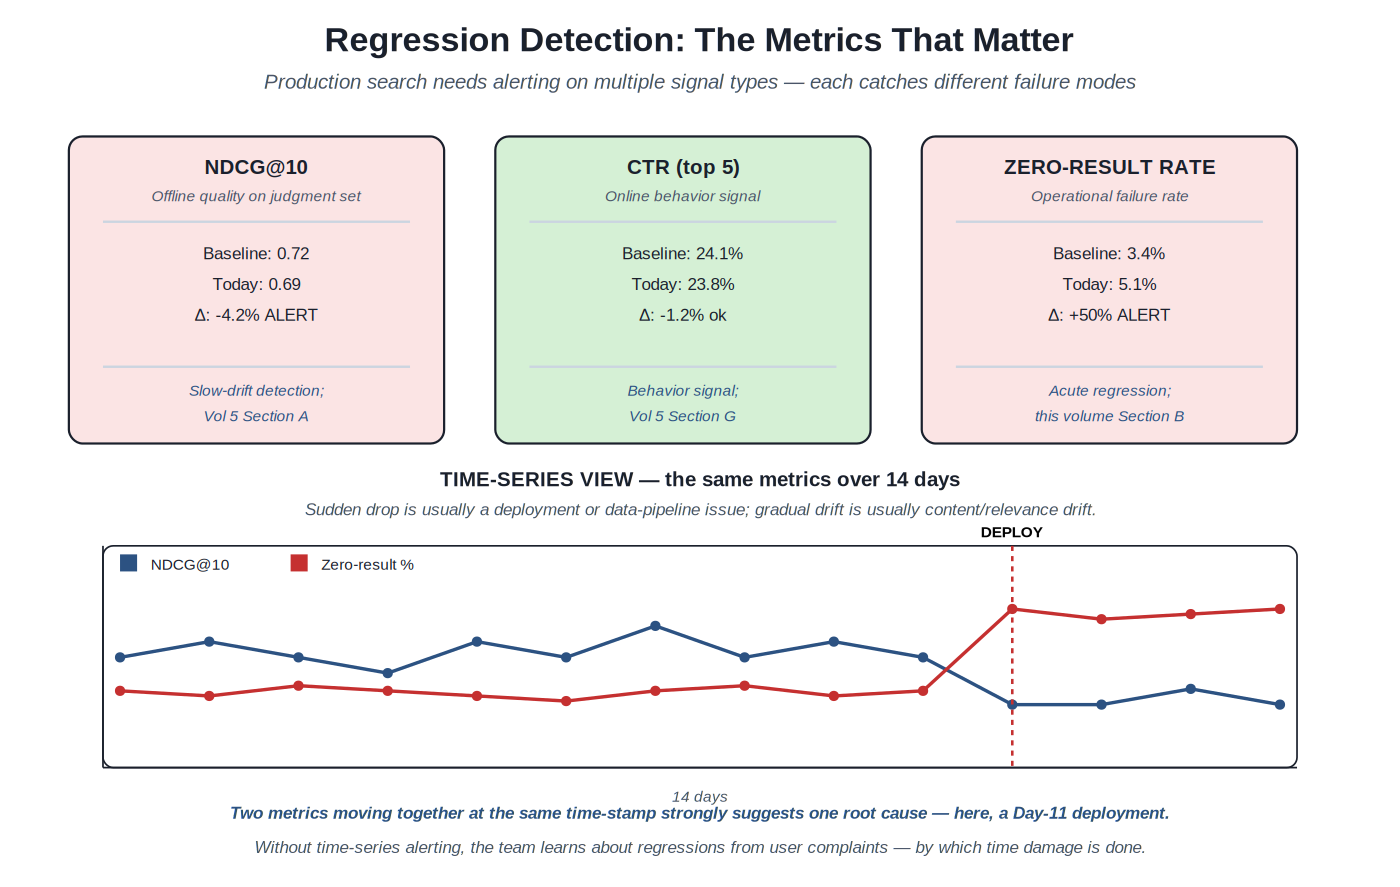
Multiple signal types catch different failure modes. Two metrics moving together at the same time-stamp strongly suggest one root cause.
The metrics worth watching. Different metrics catch different failure modes. NDCG@K (and related measures from Volume 5 Section B) catches slow-drift quality regressions — the kind that builds up gradually as content changes or ranking-model freshness decays. CTR@K catches user-behavior changes — users may behave differently for reasons unrelated to ranking, but a sudden CTR drop signals a meaningful change. Zero-result rate catches acute regressions — if a tokenization change breaks matching for 5% of queries, the zero-result rate jumps immediately. Latency and error rate catch infrastructure regressions — the search system may be returning correct results but slowly enough that users give up. Production deployments need alerting on multiple metrics; no single metric catches everything.
Alert thresholds. Each metric has a natural variance; alerts need thresholds that signal real changes without firing on normal variation. Production patterns: compare the current value to a rolling baseline (e.g., the same metric averaged over the prior 14 days); alert when the deviation exceeds N standard deviations or N percentage points; require persistence (the deviation must persist for a minimum time window) to avoid alerting on transient blips. The thresholds are workload-specific; teams typically tune them based on observed false positive vs false negative rates over months of operation.
Root cause analysis. When an alert fires, the diagnostic work begins. The methodology resembles software debugging: identify what changed and when; correlate the change timing with the regression timing; narrow to the specific component that changed; confirm by examining specific affected examples. Common change types: code deployments to the search service; data pipeline changes affecting indexed content; analyzer or schema changes; embedding model updates; ranking model retraining; upstream data source changes. The investigation works through these systematically; production teams maintain change logs that correlate deployments to alert times.
The role of pipeline tracing. Search systems are pipelines; a regression in the final output can have its root cause anywhere along the pipeline. Pipeline tracing — logging or sampling intermediate outputs at each stage — enables narrowing. For a specific affected query: what did query understanding produce? What did retrieval produce? What did ranking produce? At which stage did the output diverge from what the previous baseline would have produced? The tracing is operationally valuable; production deployments instrument the pipeline to enable it.
Validation before rollback. The standard response to a confirmed regression is rollback: revert the change that caused it. But rollback isn't always available (the change may be entangled with other changes that shouldn't roll back) and isn't always the right answer (the change may be improving overall quality but degrading a specific segment that warrants attention rather than reversion). The discipline is investigating before reacting: understand what changed, who's affected, what the trade-offs are, before deciding the response.
Chapter 5. Tuning Workflows and Iteration
Operations produces a steady stream of small changes. Synonym additions, spell-correction tweaks, ranking adjustments, schema additions, enrichment refinements — each modest in isolation, substantial in aggregate. The patterns for proposing, testing, and shipping these changes are the substance of the tuning workflow. The workflow has structural elements that distinguish effective teams from struggling ones.
Propose, power-calc, run, analyze, decide. Each stage has discipline that the practical experience of running many tests informs.
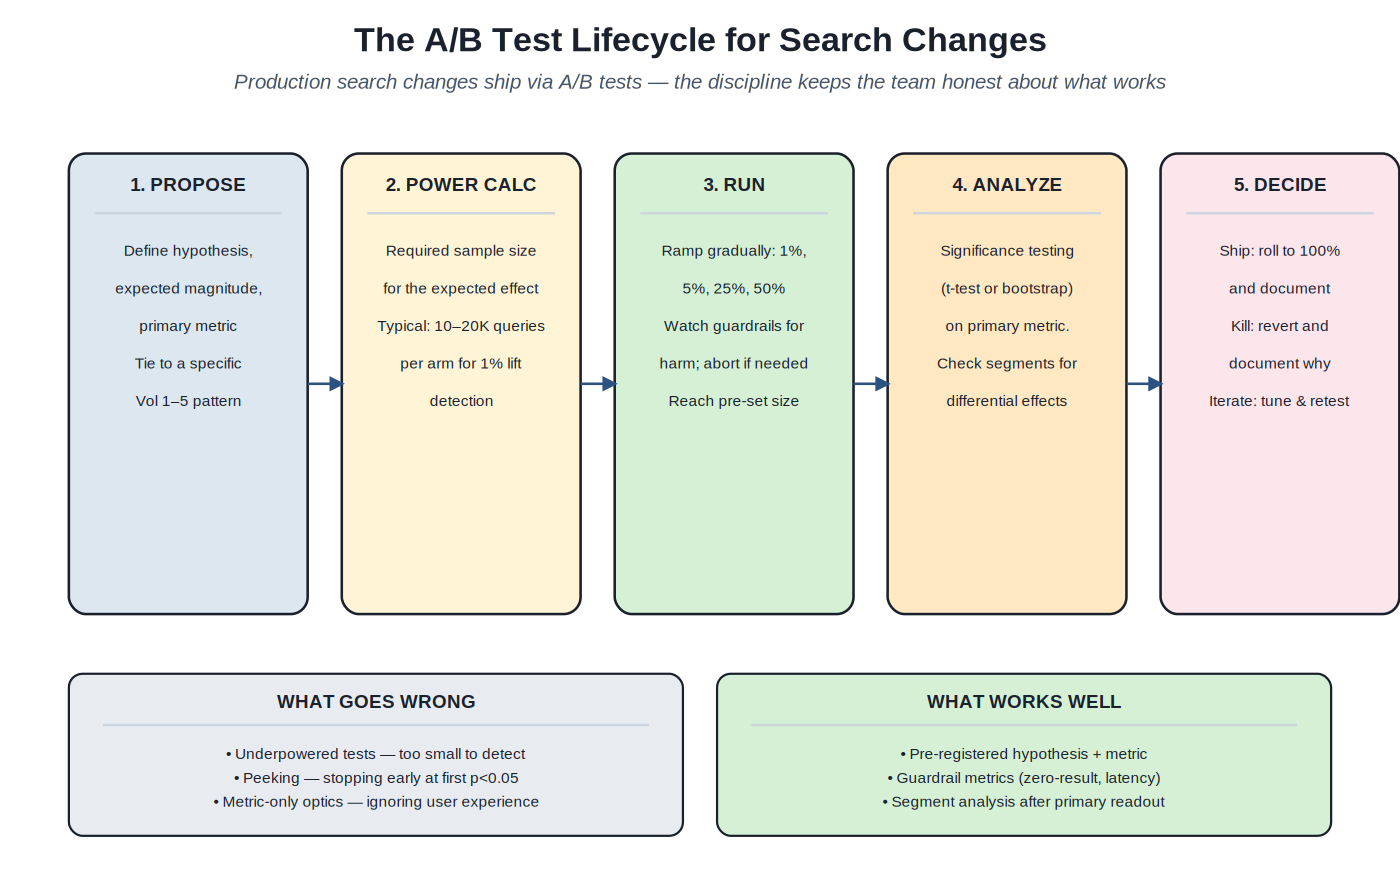
The A/B testing default. Production search changes ship via A/B tests by default. The pattern: define a hypothesis ("Adding sneakers as a synonym for running shoes will improve CTR for queries containing sneakers by 1–2%"); calculate the sample size needed to detect the expected effect; ramp gradually (1%, 5%, 25%, 50%); monitor guardrail metrics during the ramp; reach the pre-calculated sample size; run significance testing on the primary metric; ship if the effect is significant and positive, kill if not. The discipline keeps the team honest about what works — changes that intuitively seemed right often don't hold up in A/B testing, and changes that seemed minor sometimes show substantial impact.
Pre-registration. Before running the test, register the hypothesis, the primary metric, and the success threshold. The pre-registration prevents post-hoc rationalization: "The primary metric didn't move but look, this segment improved" is invalid if the segment wasn't the pre-registered focus. Production patterns: maintain a registry of running and completed tests; require pre-registration entries before test launch; treat unregistered tests as exploratory rather than confirmatory.
Power calculation. Underpowered tests — too small to detect the expected effect — are the most common A/B testing failure mode. A test running on 1,000 queries can't detect a 0.5% lift in CTR; the natural variance overwhelms the signal. Power calculation specifies the minimum sample size needed for a given effect size at a given significance level. For typical search A/B tests, this means 10,000–20,000 queries per arm for 1% lift detection at 80% power; smaller effects need more. Production teams compute this before launching tests; teams that don't typically run too many underpowered tests and learn nothing.
Guardrail metrics. The primary metric is the success criterion, but other metrics need watching. A change that improves CTR but increases zero-result rate is probably bad. A change that improves NDCG but increases latency may be problematic. A change that improves overall metrics but tanks a specific user segment may warrant rethinking. Guardrails are pre-defined: if guardrail metrics regress beyond thresholds during the test, the test is paused for investigation. Production deployments typically have 5–10 guardrail metrics tracking different aspects of search quality and user experience.
Decision after analysis. Tests produce one of three outcomes. Ship: the primary metric moved significantly in the desired direction without unacceptable guardrail regression; roll the change to 100% and document the outcome. Kill: the test failed to show the expected effect (or showed it in the wrong direction); revert and document why the hypothesis was wrong. Iterate: the test showed partial success or surprising effects; modify the approach and retest. The discipline is making the decision based on the pre-registered criteria, not based on whether the team likes the result. Teams that ship despite failed tests, or kill despite successful tests because of unmeasured concerns, undermine the discipline.
Tuning cadence. The team that runs the tuning loop weekly produces sustained improvements. The team that runs it monthly produces less. The team that runs it quarterly produces little. The cadence depends on team size and infrastructure; a team of 2–3 search engineers with mature A/B testing infrastructure can typically run 4–10 tests per quarter, with continuous query log investigation in between. The cadence is structural — dedicated time, dedicated infrastructure, dedicated review — not driven by ad-hoc enthusiasm.
Part 2 — The Substrates
Eight sections cover the operational patterns of search engineering. Each section opens with a short essay on what its patterns share. Representative patterns appear in the Fowler-style template with concrete artifacts for the central methods.
Sections at a glance
- Section A — Query log analysis patterns
- Section B — Zero-result query handling
- Section C — Low-CTR query investigation
- Section D — Regression detection and alerting
- Section E — Root cause analysis methodology
- Section F — A/B testing operations
- Section G — Index health and monitoring
- Section H — Discovery and resources
Section A — Query log analysis patterns
The data foundation: collecting, enriching, aggregating, and analyzing production query data
Every operational pattern in this volume depends on query log data. This section documents how production teams build and use the query log analytics that drive everything else — from the schema decisions in the log itself to the standard analytical views that surface action items.
Production query log schema and standard analytical views #
Source: Production methodology at major search teams; query log analytics literature; data engineering patterns for analytical workloads
Classification — The structural pattern for capturing, enriching, and querying production search events for operational analysis.
Capture production search events with sufficient detail and enrichment to support all downstream operational analyses — zero-result investigation, regression detection, A/B test evaluation, query trend analysis — without requiring re-instrumentation each time a new view is needed.
Search teams without proper query logging are operating on speculation. The team doesn't know which queries failed, which results users clicked, what reformulations users made, or whether the system's metrics this week match last week's. The investment in query log infrastructure is foundational; every other operational pattern depends on it being in place. The patterns documented here capture what to log, how to enrich it, and the standard views that mature teams build on top.
Event schema. The query log captures one event per query. Core fields: event_id (unique identifier); user_id (where available; respect privacy constraints); session_id; query_text (as the user typed it); query_normalized (after tokenization for matching purposes, useful for aggregation); timestamp; locale; device_type; result_count (number of documents returned); top_result_ids (IDs of the top N results, typically 10 or 20); query understanding output (intent class, confidence, extracted entities, expanded terms); ranking output (final ordered list with scores). Subsequent events link to the query event by ID: click events (which result was clicked, at what position, after what time); conversion events (purchase, add-to-cart, signup, whatever the downstream business action is); reformulation events (subsequent queries in the same session).
Enrichment. Raw events are enriched post-capture for analytical convenience. Standard enrichments: intent classification (already in raw events typically, but may be re-computed for retrospective analysis with newer models); session linking (group events by session_id with appropriate session timeout logic); reformulation detection (queries within a session that occur shortly after a previous query and share some terms are reformulations); outcome attribution (did the session lead to a conversion? at which query in the session?); query class binning (zero-result, low-CTR, high-CTR, navigational, informational). The enrichment runs as a batch job over the previous day's events; results are stored alongside raw events in the analytics warehouse.
Sampling. Production search at scale produces too many events for naive analysis. Patterns: log all events but sample 1–5% for ad-hoc analytics (the sample is statistically representative for aggregate measures); log all events for specific event types where sampling distorts analysis (e.g., conversion events should not be sampled because they're rare); retain different data for different durations (raw events for 30–90 days; aggregated stats indefinitely). The sampling and retention strategy balances storage cost with analytical capability.
Standard views. Mature operations teams build standard views that drive routine work. Daily zero-result query report (top 100 zero-result queries by frequency, with intent classification). Weekly low-CTR query report (queries with high impressions and low CTR, sorted by total impressions × (1 − CTR)). Reformulation chains (sessions where users issued multiple queries, surfacing patterns of search difficulty). Query trend report (which queries are growing in frequency week-over-week). Metric dashboards (NDCG, CTR, zero-result rate, latency over time). Each view is a query against the warehouse that runs daily or on demand.
Joining with other data. Query logs are most powerful when joined with other data. Product catalog (the documents being searched): which categories of documents are getting zero-result queries? User profile data (where privacy permits): how do different user segments search differently? Conversion data: which queries lead to high-value outcomes, and which lead to abandonment? The joins are routine warehouse operations; the analytical power comes from the combinations.
Privacy considerations. Query log data includes user-typed text and behavior; this is privacy-sensitive. Production discipline: anonymize where possible (hash user IDs; truncate timestamps to coarser granularity for long-term retention); enforce access controls (not everyone needs raw query access); apply retention policies (delete or aggregate raw data after a defined period); document data flows for compliance review (GDPR in Europe, CCPA in California, sector-specific regulations like HIPAA for healthcare). The patterns vary by jurisdiction and industry; the discipline is treating query log data as the sensitive data it is.
Infrastructure choices. The pipeline typically uses: a streaming layer (Kafka, Pub/Sub) for low-latency event capture; a data warehouse (BigQuery, Snowflake, Redshift) or analytical database (ClickHouse, Druid) for analytical queries; a BI / dashboarding tool (Looker, Tableau, Metabase, custom) for routine views. The choices depend on the team's broader data infrastructure; search-specific custom builds are rarely justified when the broader product analytics infrastructure can be extended.
Every production search system benefits from query log analytics. The investment is foundational; without it, no other operational pattern works. Teams without query logs should treat building them as priority infrastructure before attempting other operations work.
Alternatives — none for serious operational practice. Some teams operate without logs and rely on user complaints or sampled manual review; this works at very small scale but doesn't scale and produces less reliable signals than log-based analysis.
- Production methodology writings at search teams (Etsy, Wayfair, Spotify, Algolia case studies)
- Search analytics literature (Croft, Metzler, Strohman; Manning et al. ch. 8)
- Data warehousing / streaming infrastructure documentation (Kafka, BigQuery, Snowflake, ClickHouse)
Schema / config
-- Production search event schema (data warehouse)
-- Captures one row per query event; linked tables for clicks and conversions

CREATE TABLE search_events (
event_id STRING NOT NULL, -- unique per event
timestamp TIMESTAMP NOT NULL,
user_id STRING, -- nullable (anonymous sessions)
session_id STRING NOT NULL,
query_text STRING NOT NULL, -- as user typed
query_normalized STRING, -- after analyzer chain
locale STRING,
device_type STRING,
result_count INT64 NOT NULL,
top_result_ids ARRAY<STRING>, -- top 20 result IDs in order
-- Query understanding output
intent_class STRING, -- nav/info/trans/conv
intent_confidence FLOAT64,
extracted_entities ARRAY<STRUCT<type STRING, value STRING, span_start INT64, span_end INT64>>,
expanded_terms ARRAY<STRING>, -- post-synonym expansion
-- Ranking output
ranked_results ARRAY<STRUCT<doc_id STRING, position INT64, score FLOAT64>>,
-- Latency
query_latency_ms INT64,
-- Experiment
experiment_id STRING, -- A/B test bucket assignment
experiment_variant STRING -- control / treatment_a / ...
)
PARTITION BY DATE(timestamp)
CLUSTER BY intent_class, user_id;

CREATE TABLE click_events (
click_id STRING NOT NULL,
event_id STRING NOT NULL, -- joins to search_events
timestamp TIMESTAMP NOT NULL,
doc_id STRING NOT NULL,
position INT64 NOT NULL, -- position clicked (1-indexed)
dwell_time_ms INT64 -- if measurable
)
PARTITION BY DATE(timestamp);

CREATE TABLE conversion_events (
conversion_id STRING NOT NULL,
event_id STRING, -- attributed search event (may be null)
timestamp TIMESTAMP NOT NULL,
user_id STRING,
session_id STRING NOT NULL,
conv_type STRING, -- 'purchase' / 'signup' / etc.
conv_value NUMERIC -- $ amount or other measure
)
PARTITION BY DATE(timestamp);
Code
-- Daily zero-result query report
-- Run this every morning; investigate the top 20-50 by frequency

WITH yesterday_events AS (
SELECT *
FROM search_events
WHERE DATE(timestamp) = CURRENT_DATE() - 1
)
SELECT
query_normalized,
ANY_VALUE(query_text) AS sample_text, -- one example of original casing/typing
COUNT(*) AS query_count,
COUNT(DISTINCT session_id) AS distinct_sessions,
ANY_VALUE(intent_class) AS dominant_intent,
-- Aggregated entity signals
ARRAY_AGG(DISTINCT e.type IGNORE NULLS) AS entity_types_seen
FROM yesterday_events
LEFT JOIN UNNEST(extracted_entities) AS e
WHERE result_count = 0
GROUP BY query_normalized
ORDER BY query_count DESC
LIMIT 100;

-- Weekly low-CTR query report
-- Joins search events with clicks; finds high-impression / low-CTR queries

WITH last_week_searches AS (
SELECT *
FROM search_events
WHERE timestamp >= TIMESTAMP_SUB(CURRENT_TIMESTAMP(), INTERVAL 7 DAY)
AND result_count > 0
),
clicks_per_query AS (
SELECT
s.query_normalized,
COUNT(DISTINCT s.event_id) AS impressions,
COUNT(c.click_id) AS clicks,
COUNT(DISTINCT CASE WHEN c.position <= 3 THEN c.event_id END) AS clicks_top3
FROM last_week_searches s
LEFT JOIN click_events c ON c.event_id = s.event_id
GROUP BY s.query_normalized
)
SELECT
query_normalized,
impressions,
clicks,
ROUND(SAFE_DIVIDE(clicks, impressions), 4) AS ctr,
-- Score: total impressions weighted by (1 - CTR) - prioritizes high-impression, low-CTR
ROUND(impressions * (1 - SAFE_DIVIDE(clicks, impressions)), 0) AS investigation_priority
FROM clicks_per_query
WHERE impressions >= 100 -- minimum frequency to investigate
ORDER BY investigation_priority DESC
LIMIT 100;
Section B — Zero-result query handling
The diagnostic methodology and the fix-cycle for zero-result queries
Zero-result queries are operational failures the user experiences directly: the search system returned nothing. The patterns in this section document the methodology for finding them in logs, diagnosing them, and fixing them — plus the production discipline that turns this into routine weekly work rather than crisis response.
The zero-result investigation cycle #
Source: Production methodology at e-commerce and content search teams; query log analysis literature
Classification — Routine weekly operational practice for finding, diagnosing, and fixing zero-result queries.
Convert zero-result query reports into a steady stream of small fixes — spell correction tweaks, synonym additions, entity recognition adjustments, content gap identifications — that compound over time into substantial search quality improvements.
Zero-result queries appear in every production search system's logs, often at meaningful rates (3–8% of total queries is common; higher for new systems or systems with poor query understanding). Without a routine for handling them, they accumulate as unmet user need that the team is invisibly producing. The discipline is making the handling routine — a weekly cycle of investigation, fixing, and validation — rather than reactive crisis response when the rate spikes.
The weekly cycle. Monday morning: pull the previous week's zero-result report (Section A view). Sort by frequency; take the top 30–50 queries. Tuesday–Thursday: investigate each, applying the diagnostic tree (Chapter 3 of Part 1). Fixes for cheap cases (spell correction, synonym additions) can be made and shipped same-week. Fixes for expensive cases (content acquisition, ranking model changes) get logged for prioritization. Friday: review the week's changes; measure their effect on the next week's zero-result rate; iterate.
Diagnostic step 1: misspelling check. Run the query through the production analyzer chain (Section A of Volume 3); see what tokens result. If the tokens aren't in the index vocabulary or appear with very low frequency, the query is likely misspelled or using unusual terminology. Solutions: tune the spell correction confidence thresholds; add the term and its correction to a manual correction list; investigate why the system didn't auto-correct. Volume 2 Section B has the methods.
Diagnostic step 2: filter check. If the query understanding extracted entities that became filters, check whether the filters are appropriate. Sometimes entity extraction over-applies: extracting "red" as a color filter when the user meant something else; extracting brand names from queries where the brand reference is incidental. Solutions: tune the entity recognition confidence thresholds; soften over-aggressive filters to soft boosts (Volume 1 Section C). Volume 2 Section E has the methods.
Diagnostic step 3: vocabulary gap check. If the query terms are spelled correctly and not over-filtered, but the index doesn't contain documents with those terms, there's a vocabulary gap. The user said "sneakers", the index says "running shoes". Solutions: add to the synonym list (Volume 2 Section F); enrich document content at index time to include the user's vocabulary (Volume 3 Section C); add LLM-based query expansion for the affected query classes. The fixes are usually straightforward; the discipline is identifying the gap and choosing the appropriate fix.
Diagnostic step 4: content gap. If none of the above apply, the user is looking for content the index genuinely doesn't have. This is a business problem (acquire the content) and a UX problem (the search should communicate the gap clearly: "we don't have results for X; here are related items"). Engineering doesn't solve content gaps; engineering documents them for business prioritization.
Tracking fixes and validating. Each fix gets logged: what query failed, what diagnostic step applied, what fix was made, what the expected impact is. The following week, check whether the fixed queries returned to non-zero in the new week's data. If they did, validate the impact magnitude (how many users were affected?) and document the success. If they didn't, re-investigate — the fix may have been wrong or incomplete.
Aggregation patterns. Investigating queries one at a time scales poorly. Patterns: group queries by linguistic similarity to find shared root causes (50 misspellings of "sneakers" suggest one fix handles all); group by extracted entity to find filter-overcorrection patterns; group by intent class to find class-specific gaps. Aggregation lets one fix address many queries.
Cadence sustainability. The discipline is sustaining the cycle. Teams that run it weekly produce sustained improvements; teams that run it sporadically don't. The work is bounded — typically 2–4 hours per week for one engineer — making it sustainable indefinitely. Without the cadence, zero-result rates drift up over time as content and vocabulary evolve; with the cadence, the rates stay controlled and the team accumulates institutional knowledge about the workload.
Every production search system. The investment is modest (one engineer, several hours per week); the returns are reliable. Even systems with already-low zero-result rates benefit from the cycle because it prevents drift.
Alternatives — reactive handling (wait for complaints or rate spikes) is less effective and produces poor user experiences in the meantime. There is no good alternative to routine query log investigation; the only question is the cadence.
- Production methodology writings on operational search practice
- Grainger, AI-Powered Search, on query handling patterns
- OpenSource Connections case studies on zero-result handling
Section C — Low-CTR query investigation
Queries that return results but don't satisfy users; the methodology for diagnosing why
Low-CTR queries are subtler than zero-result queries. The system did return results; the user didn't click them. The failure mode could be in ranking (wrong order), retrieval (wrong candidates), query understanding (wrong intent leading to wrong results), or presentation (good results that didn't look clickable). The investigation methodology disambiguates these.
Low-CTR investigation methodology #
Source: Production methodology at search teams; click modeling literature; Volume 5 evaluation methods
Classification — Routine operational practice for investigating queries where the system returned results but users didn't click them.
Diagnose why users aren't clicking returned results, tracing the failure to the specific pipeline component responsible — retrieval, ranking, query understanding, or presentation — and routing the fix to the appropriate technical discipline.
Low-CTR queries are common but ambiguous. The user typed something; the system returned results; the user didn't engage. The cause could be: the system retrieved irrelevant documents (retrieval problem); the system retrieved good documents but ranked irrelevant ones higher (ranking problem); the system misunderstood the query intent (query understanding problem); the system's presentation (titles, snippets) didn't communicate relevance (UX problem); or the user changed their mind (no problem at all). Investigation disambiguates.
Step 1: confirm the signal is real. Not every low CTR is a problem. Some queries have inherently low CTR — informational queries where users read the snippets without clicking; very specific queries where users found their answer without clicking. Look at session behavior: did the user reformulate the query (suggests dissatisfaction)? Did they leave the session quickly (suggests they got their answer or gave up)? Did they engage with results elsewhere? The signal that warrants investigation is low CTR combined with reformulation or session abandonment.
Step 2: judge the result quality directly. For a representative sample of affected queries, manually inspect the returned results. Apply judgment: are the top results relevant to the query? If yes, the failure is in presentation or user expectation; if no, the failure is in retrieval or ranking. The manual judgment is essential; metrics aggregate behavior, but the underlying question is whether the results themselves are good.
Step 3: trace through the pipeline. For queries with bad results, trace through pipeline stages. Query understanding: did intent classification produce the right class? Did entity extraction identify the right entities? Are the right synonyms expanded? Retrieval: are the relevant documents in the retrieval candidates at all? If they are but rank low, ranking is the problem; if they aren't, retrieval is the problem. Volume 4's feature analysis and Volume 5's judgment-based evaluation provide the tools.
Step 4: identify the fix domain. The investigation produces a specific diagnosis: "retrieval is finding the right documents but ranking is suppressing them because feature X is misbehaving"; or "query understanding is classifying these as transactional when they're informational, routing them to inappropriate retrieval"; or "the results are good but the snippets are uninformative". The diagnosis points to a specific volume and section: Volume 2 for query understanding fixes, Volume 4 for ranking fixes, Volume 1 for retrieval architecture fixes, Volume 7 (planned) for presentation fixes.
Step 5: validate the fix. Once a fix is proposed, validate it: does the judgment set evaluation (Volume 5 Section A) improve for the affected queries? An A/B test (Section F of this volume) confirms online behavior change. Ship if validated; iterate if not.
Common patterns. Some patterns recur. Intent misclassification leading to wrong retrieval routing is common in workloads with subtle intent distinctions. Ranking models suppressing fresh content because freshness features aren't updated frequently enough. Snippet generation cutting off the relevant portion of long documents. Each pattern has its own fix domain; recognizing patterns speeds up future investigations.
When to escalate. Some low-CTR patterns can't be fixed by tuning. The system may need new ranking features, a different retrieval architecture, or new content. The discipline is recognizing when tuning has run out of room and a larger investment is warranted. Production teams typically escalate to project work when the same pattern persists across multiple tuning cycles.
Production search systems with sufficient query volume to produce reliable low-CTR signals. Investigations are routine weekly work, similar to zero-result handling.
Alternatives — the methodology applies broadly; no good alternatives.
- Production methodology writings on operational search practice
- Click modeling literature (Joachims, Granka, Pan on user behavior signals)
- Volume 5 of this series for the evaluation infrastructure
Section D — Regression detection and alerting
The metrics, the thresholds, and the alerting infrastructure
Production search systems need automated regression detection. Without it, the team learns about quality drops from user complaints — by which time damage is done. The patterns in this section document the metrics worth alerting on, the threshold-setting discipline, and the operational response when alerts fire.
Multi-signal regression detection and alerting #
Source: Production methodology at major search teams; SRE alerting literature; Volume 5 evaluation infrastructure
Classification — Pattern for detecting search-quality regressions early through automated monitoring of multiple metric types.
Detect search-quality regressions promptly through automated monitoring of offline quality, online behavior, and operational metrics — with alert thresholds tuned to balance false positives against undetected real regressions.
Regressions happen. The question is whether the team detects them in hours or in weeks. Hours-to-detection enables proactive response: investigate, root-cause, fix, often before user complaints reach support. Weeks-to-detection means damage has accumulated; users have given up on queries that don't work; the team starts the investigation already behind. Automated regression detection collapses the gap.
Metric selection. Different metrics catch different failure modes; production deployments monitor several. Offline quality on judgment set (NDCG@K, MRR; Volume 5 Section B) catches gradual ranking drift and acute ranking regressions for known query types. Online behavior (CTR@K, position-1 CTR, deep-click rate) catches user-behavior changes that may or may not reflect quality changes. Operational health (zero-result rate, error rate, p95/p99 latency) catches infrastructure and indexing failures. Conversion impact (where business KPIs are available) catches changes that affect downstream business metrics. Each metric needs alerting; the combination produces coverage.
Threshold setting. The discipline of choosing thresholds. Approaches: percentage-based (alert when current deviates more than N% from a rolling baseline); standard-deviation-based (alert when current is more than K standard deviations from baseline); seasonality-adjusted (compare current to the same day-of-week from prior weeks to account for weekly patterns); absolute (alert when zero-result rate exceeds N%, regardless of historical baseline). Production deployments often combine: percentage-based for sensitive detection, absolute for catching specific failure thresholds, seasonality for noisy metrics.
Persistence requirements. Single data points can be noisy. Production alerts typically require persistence: the deviation must persist for a minimum time window (e.g., 30 minutes or 1 hour for high-frequency metrics; 24 hours for daily-rollup metrics) before alerting. The persistence requirement filters out transient blips that don't warrant investigation while still detecting genuine regressions promptly.
Segmentation. Aggregate metrics can mask segment-specific regressions. A change that improves overall NDCG by 1% but drops NDCG for navigational queries by 10% is a regression for navigational users. Production patterns: track metrics per major segment (per intent class, per device type, per locale); alert when segment-specific metrics regress even if overall metrics are stable. The pattern adds infrastructure complexity but catches important regressions.
Alert routing. When alerts fire, they need to reach the right people. Production patterns: route by alert type and severity; high-severity to on-call rotations with phone/SMS; medium-severity to team channels (Slack, Teams); informational to dashboards and weekly reports. The routing keeps the noise to a level the team can sustain while ensuring serious regressions get fast attention.
False positive management. Alert thresholds inevitably produce some false positives. The discipline: track false positive rate over time; tune thresholds when false positives accumulate; document known false positive patterns ("the weekly batch reindex causes a 30-minute zero-result spike") so on-call doesn't investigate them as novel issues; revisit tuning when the workload changes. Without false positive management, alert fatigue sets in and real alerts get ignored.
Post-alert workflow. When an alert fires, the response follows a pattern: acknowledge the alert (so the team knows someone is investigating); identify recent changes (deployments, data pipeline runs, model updates) that could correlate with the alert timing; sample specific affected queries to confirm the regression is real; if real, decide on rollback or investigation; communicate status. The workflow is operational discipline; documented runbooks help on-call engineers respond consistently.
Integration with broader observability. Search quality alerts integrate with the company's broader observability stack. Production patterns: shared dashboards with engineering teams (search depends on infrastructure that other teams maintain); shared alerting infrastructure (PagerDuty, Opsgenie, or equivalents); shared incident management processes (SEV-level definitions, communication patterns, post-mortems). The integration prevents search operations from being a parallel universe disconnected from broader engineering practice.
Every production search system at scale benefits from automated regression detection. The investment is modest (the metrics, infrastructure, and alerting are extensions of broader product analytics); the returns are substantial. Systems without alerting accumulate undetected regressions.
Alternatives — manual periodic review (works for very small systems, doesn't scale). User complaint monitoring (catches only the regressions users are vocal about; misses the silent ones). Automated alerting is the only scalable approach.
- Production SRE methodology writings on alerting (Google SRE book, ch. 6)
- Search team postmortems and case studies
- Volume 5 of this series for the evaluation infrastructure
Code
-- Regression detection: daily metric snapshot with anomaly flagging
-- Run as a scheduled query; alert on rows where is_anomaly = TRUE

WITH metric_snapshot AS (
SELECT
DATE(timestamp) AS metric_date,
intent_class,
-- Quality metrics
AVG(CAST(judged_ndcg_at_10 AS FLOAT64)) AS avg_ndcg_at_10,
-- Behavior metrics
SAFE_DIVIDE(
COUNT(DISTINCT CASE WHEN has_top3_click THEN event_id END),
COUNT(DISTINCT event_id)
) AS ctr_top3,
-- Operational metrics
SAFE_DIVIDE(
COUNT(CASE WHEN result_count = 0 THEN 1 END),
COUNT(*)
) AS zero_result_rate,
APPROX_QUANTILES(query_latency_ms, 100)[OFFSET(95)] AS p95_latency,
COUNT(*) AS query_count
FROM search_events s
LEFT JOIN judgment_results j ON j.event_id = s.event_id
LEFT JOIN (
SELECT event_id, MAX(CASE WHEN position <= 3 THEN TRUE END) AS has_top3_click
FROM click_events
GROUP BY event_id
) c ON c.event_id = s.event_id
WHERE DATE(timestamp) >= CURRENT_DATE() - 30
GROUP BY metric_date, intent_class
),
baselines AS (
SELECT
intent_class,
AVG(avg_ndcg_at_10) AS baseline_ndcg,
STDDEV(avg_ndcg_at_10) AS stddev_ndcg,
AVG(zero_result_rate) AS baseline_zr,
STDDEV(zero_result_rate) AS stddev_zr
FROM metric_snapshot
WHERE metric_date BETWEEN CURRENT_DATE() - 28 AND CURRENT_DATE() - 2
GROUP BY intent_class
)
SELECT
s.metric_date,
s.intent_class,
s.avg_ndcg_at_10,
s.zero_result_rate,
s.p95_latency,
s.query_count,
-- Deviation from baseline
ROUND((s.avg_ndcg_at_10 - b.baseline_ndcg) / NULLIF(b.stddev_ndcg, 0), 2) AS ndcg_z_score,
ROUND((s.zero_result_rate - b.baseline_zr) / NULLIF(b.stddev_zr, 0), 2) AS zr_z_score,
-- Anomaly flag: > 2 stddev in bad direction
CASE
WHEN (s.avg_ndcg_at_10 - b.baseline_ndcg) / NULLIF(b.stddev_ndcg, 0) < -2 THEN TRUE
WHEN (s.zero_result_rate - b.baseline_zr) / NULLIF(b.stddev_zr, 0) > 2 THEN TRUE
WHEN s.p95_latency > 2000 THEN TRUE -- absolute threshold: p95 > 2 seconds
ELSE FALSE
END AS is_anomaly
FROM metric_snapshot s
JOIN baselines b USING (intent_class)
WHERE s.metric_date = CURRENT_DATE() - 1
ORDER BY is_anomaly DESC, s.intent_class;

-- Outputs are consumed by an alerting webhook:
-- - rows with is_anomaly = TRUE -> page on-call via PagerDuty/Opsgenie
-- - all rows -> log to daily metrics dashboard
-- - z-scores -> retain for trend analysis
Section E — Root cause analysis methodology
Moving from "something is wrong" to "this specific component caused it"
When a regression alert fires, the response is investigation. The patterns in this section document the methodology for tracing a regression to its root cause efficiently — pipeline tracing, change correlation, hypothesis testing.
Pipeline tracing and change correlation for root cause analysis #
Source: Production debugging methodology; SRE postmortem patterns; search-specific diagnostic experience
Classification — Diagnostic methodology for identifying the specific component or change that produced a search-quality regression.
Move from a fired regression alert to a confirmed root cause efficiently by tracing the search pipeline for affected queries, correlating regression timing with recent changes, and validating hypotheses against specific evidence.
A regression alert tells the team that something is wrong. It doesn't tell them what. The investigation work is finding the specific component, change, or interaction responsible. Without methodology, investigations meander — the team checks the components they happen to think of, in the order they think of them, until they find something. With methodology, investigations are structured: correlate timing with changes, trace affected queries through the pipeline, narrow to the responsible stage, identify the specific change.
Step 1: confirm and characterize. Before investigating, confirm the regression is real and characterize its scope. Is the metric drop sustained or a transient? Which segments are affected (all queries, or specific intent classes, locales, or user types)? When did the regression start — sharp drop or gradual decline? The characterization narrows the investigation: a sharp drop suggests a discrete change; a gradual decline suggests drift; segment-specific impact suggests segment-specific causes.
Step 2: correlate with recent changes. List changes that occurred near the regression timestamp. Code deployments to the search service; data pipeline changes (indexing job runs, content ingestion changes); analyzer or schema changes; embedding model updates; ranking model retraining; upstream data source changes (catalog updates, product feed changes); third-party dependency changes (vector DB upgrades, embedding API changes). Production teams maintain change logs that correlate to the alerting timeline; the correlation often points immediately at the cause.
Step 3: sample affected queries and trace them. For the segment showing regression, pull a sample of specific affected queries. For each query, trace through the pipeline: what did query understanding produce (intent, entities, expansions)? What did retrieval return (candidate documents and scores)? What did ranking produce (final order)? Compare to what the previous baseline would have produced if you can (some pipelines log enough detail for retrospective comparison; otherwise re-run with the prior configuration). The trace identifies which stage produced different output than before.
Step 4: narrow to specific change. Once the responsible stage is identified, narrow within it. If query understanding regressed: which sub-stage — tokenization, spell correction, intent classification, entity extraction? If retrieval regressed: which retrieval path — lexical, vector, hybrid? If ranking regressed: which feature or model component? The narrowing typically requires examining the stage's configuration, the model in use, and the recent changes to either.
Step 5: validate the hypothesis. Once a candidate root cause is identified, validate it. Approaches: revert the change in a test environment and confirm the metric recovers; apply the change to a small traffic slice and confirm the metric regresses; manually examine before/after outputs for specific queries to confirm the change produces the observed behavior. Hypothesis validation prevents premature conclusions; the easy intuitive answer is often wrong.
Common patterns. Some root causes recur. Tokenization changes that affect a subset of queries: catches when the analyzer chain was modified for a specific case but the change has broader effects. Model retraining that picks up unstable features: the new model is technically better on the training data but degrades on production queries with different feature distributions. Embedding model versioning mismatches: queries embedded by the new model search against documents embedded by the old, producing degraded matches. Upstream data source schema changes: a field renamed in the catalog feed loses its content in the index without obvious error. Documented patterns speed up future investigations.
Documentation and learning. Every confirmed root cause produces operational knowledge. Production teams maintain incident postmortems documenting: what went wrong; how it was detected; how it was diagnosed; how it was fixed; what prevented earlier detection; what changes would prevent recurrence. The postmortems become institutional memory; new team members read them to understand the failure modes the team has encountered. The discipline turns each incident into a learning opportunity rather than just an interruption.
The cost of skipped methodology. Teams that don't apply systematic investigation often misdiagnose. The team fixes the wrong thing; the original problem persists; user complaints continue; the team's credibility suffers. The discipline of methodology is what separates effective teams from frustrated ones — not raw technical knowledge, but the structured approach to applying it.
Any time a regression alert fires or a quality issue is reported. The methodology scales from minor tuning issues to major incidents; the discipline is consistent application.
Alternatives — ad-hoc investigation works for some issues but produces unreliable results. The systematic methodology produces better diagnoses in less average time, even if individual investigations sometimes feel slow.
- SRE incident response methodology (Google SRE book, ch. 14)
- Production debugging literature
- Volume 5 of this series for the measurement infrastructure that root-cause investigation depends on
Section F — A/B testing operations
Power calculation, ramping, analysis, and decision-making for search changes
Chapter 5 of Part 1 introduced the A/B testing lifecycle. This section documents the operational patterns in detail: how to compute required sample size, how to structure ramps, how to analyze results, how to make ship/kill decisions consistently.
A/B testing for search changes with power calculation and guardrails #
Source: Production A/B testing methodology at major web search and e-commerce companies; statistical literature on online experiments
Classification — End-to-end pattern for proposing, running, analyzing, and deciding on search changes via controlled online experiments.
Convert proposed search changes into shipped improvements (or learned-from failures) via the discipline of controlled experimentation, with statistical rigor that distinguishes real effects from noise.
Search changes look promising in development but their production effect is often different. Synonym additions that seem clearly helpful may not move metrics; ranking adjustments that look minor may have substantial impact; query understanding changes may help one segment while hurting another. The discipline of A/B testing makes these dynamics visible; without it, the team ships changes based on intuition and never learns what actually works.
Hypothesis registration. Before running the test, write down: the change being tested; the primary metric expected to move; the expected magnitude ("+1–2% CTR for queries containing X"); the segment expected to be most affected; the guardrail metrics that must not regress. The registration is auditable; the test's success criterion is the pre-registered metric meeting the pre-registered threshold. Production patterns: maintain a registry (spreadsheet, internal tool) of all tests with their registrations; revisit the registry monthly to evaluate the team's hit rate (what fraction of tests show their expected effect?).
Power calculation. Compute the sample size needed to detect the expected effect at the desired statistical power. For a binomial metric (CTR) with baseline rate p and expected lift d, the required sample size per arm scales roughly as: n ≈ 16 × p × (1−p) / d² (at 80% power, 5% significance). For CTR baseline 20% and lift 1%: n ≈ 16 × 0.2 × 0.8 / 0.0001 = 25,600 queries per arm. For continuous metrics (NDCG, dwell time), use t-test sample-size formulas. Most A/B testing platforms (Google Optimize, Optimizely, internal builds) provide power calculators; the discipline is using them.
Bucket assignment. Users (or sessions, or queries) get assigned to test buckets via deterministic hashing on a stable identifier. The hash ensures that the same user sees consistent behavior throughout the test (and across multiple tests, if appropriate). Production patterns: hash on user_id where users are logged in; hash on session_id otherwise; document the assignment unit explicitly (user-level vs session-level vs query-level matters for analysis).
Ramping. Tests typically ramp gradually before reaching full sample: 1%, 5%, 25%, 50%. The ramp serves two purposes: catches catastrophic regressions before they affect many users (guardrail metrics monitored during ramp); reveals scale-dependent effects (some changes work at small scale but not at large). At each ramp level, the team holds for a defined period (24–48 hours typical) and reviews guardrails before advancing. The ramp can be paused or reverted if guardrails fail.
Guardrail monitoring. During the test, monitor guardrail metrics for the test arm. Common guardrails: zero-result rate (must not increase substantially); latency p95 (must not increase); revenue per session (for e-commerce; must not decrease); specific subgroup metrics (the change should help the target segment without harming others). Guardrail violations during ramp pause the test for investigation; not every guardrail violation kills a test (some are noise or expected) but each warrants review.
Analysis. After reaching the pre-calculated sample size: compute the primary metric for control and treatment arms; compute the statistical significance (typically using t-test or bootstrap, depending on metric properties); check the segment analyses identified in the registration. The analysis follows the registration: significance on the pre-registered metric with the pre-registered direction is the success criterion. Production patterns: don't peek at significance during the test (peeking inflates false positive rate); use sequential testing methods if you genuinely need early stopping; document the analysis methodology so it's consistent across tests.
Decision-making. Three outcomes: ship (primary metric moved significantly in the desired direction, guardrails held); kill (primary metric didn't move or moved wrong direction); iterate (mixed results suggesting the approach has merit but needs adjustment). The decision follows the pre-registered criteria. Production discipline: write a decision document with the test outcome, the decision rationale, and what was learned. The document is auditable and feeds future test design.
Common failures. Underpowered tests — too small to detect realistic effects. Peeking — stopping when p<0.05 first arises rather than at the pre-registered sample size; inflates false positive rate substantially. Metric-only optics — declaring success based on metrics while missing user-experience issues that metrics don't capture. Multiple comparison without correction — testing many metrics and declaring success on any that moved; needs Bonferroni or similar correction. Segment cherry-picking — looking for any subgroup where the change helped, after the primary metric failed. The disciplines for avoiding each are well-established; production teams encode them in their testing infrastructure.
Most production search changes — ranking adjustments, query understanding updates, schema changes, synonym additions, analyzer changes. The discipline applies broadly; the only changes that don't need A/B testing are bug fixes (where the right answer is unambiguous) and infrastructure changes that shouldn't affect search quality (where guardrails are sufficient).
Alternatives — offline-only evaluation for the rare changes where the judgment set is sufficient (and the team accepts that production behavior may differ). Pre/post analysis for changes that can't be A/B tested (rare in modern infrastructure); pre/post is less rigorous than A/B because it doesn't control for confounding changes.
- Kohavi, Tang, Xu, "Trustworthy Online Controlled Experiments" (Cambridge, 2020) — the canonical text
- Production methodology writings from Google, Microsoft, Etsy, Bing on search A/B testing
- Statistical literature on power calculation and sequential testing
Code
# Search A/B test analysis with power calculation, significance testing, and segments
import numpy as np
from scipy import stats
import pandas as pd

def required_sample_size(baseline_rate: float, expected_lift: float,
alpha: float = 0.05, power: float = 0.80) -> int:
"""Compute required sample size per arm for binomial metric (e.g., CTR).
Returns sample size per arm needed to detect the expected lift
at the given significance level and power.
"""
p1 = baseline_rate
p2 = baseline_rate + expected_lift
pooled = (p1 + p2) / 2
z_alpha = stats.norm.ppf(1 - alpha / 2)
z_beta = stats.norm.ppf(power)
numerator = (z_alpha * np.sqrt(2 * pooled * (1 - pooled)) +
z_beta * np.sqrt(p1 * (1 - p1) + p2 * (1 - p2))) ** 2
denominator = (p2 - p1) ** 2
return int(np.ceil(numerator / denominator))

# Example: detect 1% absolute lift on 20% baseline CTR
n = required_sample_size(baseline_rate=0.20, expected_lift=0.01)
print(f"Sample size per arm: {n:,}")
# Output: Sample size per arm: ~25,000

def analyze_ab_test(
df: pd.DataFrame, # columns: variant ('control' / 'treatment'), clicked (bool)
metric_col: str = 'clicked',
segment_col: str | None = None,
) -> dict:
"""Compute test results: lift, significance, confidence interval.
Optionally segment by another column.
"""
results = {}
def compute_stats(group_df):
control = group_df[group_df.variant == 'control'][metric_col].values
treatment = group_df[group_df.variant == 'treatment'][metric_col].values
if len(control) == 0 or len(treatment) == 0:
return None
c_rate = control.mean()
t_rate = treatment.mean()
lift_abs = t_rate - c_rate
lift_rel = lift_abs / c_rate if c_rate > 0 else None
# Two-proportion z-test
pooled = (control.sum() + treatment.sum()) / (len(control) + len(treatment))
se = np.sqrt(pooled * (1 - pooled) * (1/len(control) + 1/len(treatment)))
z = lift_abs / se if se > 0 else 0
p_value = 2 * (1 - stats.norm.cdf(abs(z)))
# 95% CI on lift
se_lift = np.sqrt(c_rate*(1-c_rate)/len(control) + t_rate*(1-t_rate)/len(treatment))
ci_low = lift_abs - 1.96 * se_lift
ci_high = lift_abs + 1.96 * se_lift
return {
'control_n': len(control),
'treatment_n': len(treatment),
'control_rate': c_rate,
'treatment_rate': t_rate,
'lift_abs': lift_abs,
'lift_rel': lift_rel,
'p_value': p_value,
'ci_95': (ci_low, ci_high),
'significant': p_value < 0.05,
}
# Overall analysis
results['overall'] = compute_stats(df)
# Per-segment if requested
if segment_col:
for segment, sub_df in df.groupby(segment_col):
results[f'segment_{segment}'] = compute_stats(sub_df)
return results

# Example usage
# df has columns: event_id, variant, intent_class, clicked
# results = analyze_ab_test(df, segment_col='intent_class')
# Inspect results['overall'] for primary; segments for differential effects.
Section G — Index health and monitoring
Ensuring the index is operating correctly day-to-day
The index is operational infrastructure. It needs monitoring like any other production system. The patterns in this section cover what to watch — indexing throughput, freshness, completeness, error rates — and what to do when these signals indicate trouble.
Index health monitoring and indexing pipeline observability #
Source: Production methodology for indexing pipeline operations; SRE observability patterns; Volume 3 indexing patterns
Classification — Operational pattern for monitoring the indexing pipeline's health and catching issues before they affect search quality.
Maintain operational visibility into the indexing pipeline — throughput, latency, freshness, completeness, error rates — so that indexing issues are caught and fixed before they degrade search quality for users.
The indexing pipeline runs continuously, often in the background, often with limited direct visibility to the search team. When it fails or degrades, the search system's quality drops without obvious cause: new content doesn't appear; updated content shows stale fields; specific document types fail to index; the index falls behind real-time content updates. Without monitoring, these issues are caught only when users notice and complain. With monitoring, the team catches them proactively.
Throughput monitoring. Track documents indexed per minute (or per hour, for slower pipelines). The metric should be steady; sudden drops suggest pipeline issues; sudden spikes suggest backlog catch-up (which may indicate prior failure). Alert when throughput drops below baseline or when the pipeline is processing zero documents for an extended period. The baseline depends on the workload — e-commerce systems may index millions of documents per day; enterprise systems may index thousands.
Freshness monitoring. Measure the lag between content changes and their appearance in the index. For real-time indexing pipelines, the lag should be seconds; for batch pipelines, the lag should be within the batch window. Alert when freshness exceeds threshold. The metric is sensitive: a document that was updated 30 minutes ago but doesn't appear with the update is a problem. Production patterns: emit a freshness signal per document (timestamp when indexed minus timestamp of source change); aggregate to p50, p95, p99 freshness; alert on p95 exceeding threshold.
Completeness monitoring. The index should contain the expected documents. Periodic checks: compare index document count to source-of-truth document count (catalog database, content management system, etc.); flag substantial discrepancies; investigate root causes. Patterns: sample documents from source and verify each is in the index with current content; spot-check critical documents (high-traffic products, important pages) for presence and currency. Without completeness monitoring, the team finds out about missing documents from user complaints.
Error rate monitoring. Indexing pipelines have failure modes: malformed source data; missing required fields; LLM API errors during enrichment; embedding API rate limits; storage failures. Track error rates per stage; alert when rates exceed baselines. Investigate spikes promptly — a steady stream of errors often indicates a systematic problem that's affecting many documents silently.
Per-field monitoring. Beyond document-level metrics, monitor field-level health. Field completion rates: what fraction of documents have non-null values for each important field? A drop in completion rate for an enriched field signals upstream issues with the enrichment process. Distribution checks: do field values follow expected distributions? Sudden changes in category distributions or price distributions signal data quality issues.
Vector index health. Vector fields have their own monitoring concerns. Vector embedding rate (documents getting embedded per unit time); embedding failure rate; vector index size; vector index recall (sample-based check that nearest-neighbor queries return expected results). Production patterns: maintain a small test set of queries with known nearest neighbors; periodically run them and verify the expected documents are returned; alert if recall drops.
Reindex monitoring. When blue/green reindexing (Volume 3 Section F) is in progress, monitor it specifically. Progress (what percentage of documents have been reindexed); ETA (when will reindex complete); errors during reindex (failures that need investigation before alias swap); validation checks (does the new index pass spot-check tests). Production patterns: dashboard the reindex progress for visibility; alert on stalls or excessive error rates; gate the alias swap on validation passing.
Integration with search-side monitoring. Index health alerts are operationally distinct from search-quality alerts but related. A regression in search quality may root-cause to an index issue (Section E covers the diagnostic methodology). Production patterns: cross-reference index health metrics with search quality metrics in the same dashboards; on-call rotations cover both areas; postmortems trace search quality issues back through to indexing causes where appropriate.
Every production search system with active indexing. The investment is modest (the monitoring extends the search engine's built-in observability); the returns prevent silent search-quality degradation.
Alternatives — manual periodic checks for small, slow-changing indices. Some systems can operate without dedicated indexing monitoring at very small scale; most cannot.
- Elasticsearch / OpenSearch / Solr operational documentation
- Production SRE observability methodology
- Volume 3 of this series for the indexing patterns being monitored
Section H — Discovery and resources
Where to track operational discipline as the field continues to evolve
Search operations draws from search engineering, SRE practice, data engineering, and increasingly from MLOps. The discipline continues to evolve as production search systems become more sophisticated.
Resources for tracking search operations discipline #
Source: Multiple practitioner, academic, and tool sources
Classification — Sources for staying current on search operations practice.
Provide pointers to the active sources of operational knowledge across search, SRE, and data engineering.
Search operations doesn't have a unified literature. Practitioners assemble methodology from multiple sources: search-specific case studies, SRE practice, data engineering patterns, MLOps tooling. The fragmentation makes the discipline harder to learn than its component parts.
Foundational texts. Kohavi, Tang, Xu, Trustworthy Online Controlled Experiments (Cambridge, 2020) — the canonical reference for A/B testing methodology. Google SRE book and Site Reliability Workbook (free online at sre.google/books) — the foundational reference for production operations; chapters on monitoring, alerting, postmortems, and incident response apply directly. Grainger, AI-Powered Search (Manning, 2024) — includes chapters on production operations for modern search. Manning et al., Introduction to Information Retrieval (free online) — ch. 8 on evaluation in IR, which underlies operational metrics.
Search-specific writing. Daniel Tunkelang on search operations and practice. OpenSource Connections on Solr/Elasticsearch operations. Search team blogs at Etsy, Wayfair, Spotify, Algolia publish substantial operational case studies periodically. Conference talks from Haystack, Berlin Buzzwords cover operational topics.
SRE and observability. Beyond the Google SRE books: Mickens, "It's the End of the Web as We Know It" and similar writing on operational practice; observability vendors (Datadog, Honeycomb, New Relic) publish substantial blog content on production observability that applies to search systems.
Data engineering. Kleppmann, Designing Data-Intensive Applications (O'Reilly, 2017) — foundational for the data pipelines that underlie query log analytics. Modern data stack blogs (dbt Labs, Astronomer/Airflow, Fivetran) cover ELT pipelines that ingest query logs into warehouses.
Tools and platforms. A/B testing: Optimizely, LaunchDarkly, GrowthBook (open source), internal builds at scale. Observability: Datadog, Honeycomb, Grafana + Prometheus, internal builds. Data warehousing: BigQuery, Snowflake, Redshift, ClickHouse. Search-specific monitoring: vendor-provided tooling (Elastic Observability, Algolia Search Insights, Coveo Analytics) plus custom dashboards on the warehouse.
Communities. Relevancy Engineering Slack for search-specific operational discussion. SRE communities (USENIX SREcon, SRE-adjacent meetups). Data engineering communities (Locally Optimistic, dbt Slack, modern data stack communities). The operational discipline of search sits at the intersection of these communities.
Emerging areas. LLM-assisted operations — using LLMs to summarize log patterns, generate investigation reports, suggest fixes. Production methodology is consolidating through 2024–2026. ML-model-specific operational practice (drift detection for ranking models, embedding-model staleness monitoring) is becoming distinct from generic search operations. Privacy-preserving operations (operating effectively with reduced query log retention, federated analytics) is becoming relevant under tightening privacy regulations.
Search engineers building or maintaining operational practice. Engineers transitioning into search from adjacent disciplines (SRE, data engineering, ML engineering). Continuous education as practices evolve.
Alternatives — specialized consulting for operational maturity engagements. Internal documentation for teams with mature practice. The combination of external tracking and internal experience is the working pattern.
- Kohavi, Tang, Xu, Trustworthy Online Controlled Experiments (Cambridge, 2020)
- Google SRE book and Site Reliability Workbook (sre.google/books)
- Kleppmann, Designing Data-Intensive Applications (O'Reilly, 2017)
- Grainger, AI-Powered Search (Manning, 2024)
- Relevancy Engineering Slack
- Haystack Conference, Berlin Buzzwords proceedings
Appendix A — Pattern Reference Table
Cross-reference of the operational patterns covered in this volume.
| Pattern | Provides | When to use | Section |
|---|---|---|---|
| Production query log schema | Foundation for all analytics | Every search system | Section A |
| Daily zero-result report | Surface fixable failures | Weekly investigation cycle | Section A, B |
| Weekly low-CTR report | Surface subtler failures | Weekly investigation cycle | Section A, C |
| Zero-result investigation cycle | Routine fix-stream | Sustained throughout production | Section B |
| Low-CTR investigation methodology | Diagnose ranking/retrieval issues | Routine alongside zero-result | Section C |
| Multi-signal regression alerting | Catch quality drops early | All production at scale | Section D |
| Pipeline tracing for root cause | Move alert → specific cause | When alerts fire | Section E |
| A/B testing with power calc | Validate changes online | Every shipping change | Section F |
| Index health monitoring | Catch indexing failures | All active indexing pipelines | Section G |
Appendix B — The Search Engineering Series
This catalog is Volume 6 of the Search Engineering Series. The current state of the series:
- Volume 1 — The Search Patterns Catalog (delivered) — query-time architectural patterns.
- Volume 2 — The Query Understanding Catalog (delivered) — the methods that produce structured query signals.
- Volume 3 — The Indexing and Document Engineering Catalog (delivered) — document-side preparation.
- Volume 4 — The Ranking and Relevance Catalog (delivered) — scoring, LTR, neural rerankers.
- Volume 5 — The Search Evaluation Catalog (delivered) — metrics, judgment, online evaluation.
- Volume 6 — The Search Operations Catalog (this volume) — the day-to-day workflow that integrates the others.
- Volume 7 — The Search UX Patterns Catalog (planned) — autocomplete, facets, snippets, did-you-mean.
- Volume 8 — The Search Platforms Survey (planned) — ES/OS/Solr/Coveo/Algolia/Vespa comparison.
With Volume 6 delivered, the series has six of its planned eight volumes. The first five (1–5) form the technical foundation; Volume 6 is the integrative practice that uses them. Volumes 7 (UX) and 8 (Platforms) cover the remaining areas — presentation that the operational work ultimately affects, and platform comparison for teams choosing or migrating. With Vol 6 done, the series has structural reference for everything a search team needs to do internally; Vols 7 and 8 are valuable but optional for many teams.
Appendix C — The Six-Volume Working Library
With Volume 6 delivered, the Search Engineering Series has its working library. Volumes 1–5 provide the technical disciplines; Volume 6 provides the integrative practice that uses them daily. The six volumes together cover the work of building, evolving, and operating production search systems.
How operations consumes the other volumes. The operational cycle (Chapter 1 of Part 1) touches every volume daily. Monitoring consumes Volume 5's evaluation infrastructure. Investigation consumes Volumes 2 (query understanding outputs visible in logs) and 3 (indexed document characteristics visible in retrieval). Diagnosis traces through Volume 1 architectural stages and Volume 4 ranking features. Fixes happen in the appropriate volumes' sections. Validation uses Volume 5's judgment-based evaluation plus this volume's A/B testing methodology. The operational discipline is fluent traversal of the technical disciplines.
Where this volume adds value beyond the others. The technical volumes describe methods; this volume describes the work of applying them under production constraints. Volume 4 explains ranking methods; this volume explains how to investigate when ranking regresses. Volume 5 explains evaluation metrics; this volume explains the alerting and response patterns built on them. Volume 2 explains query understanding; this volume explains the routine investigation that surfaces gaps. The volumes complement: methods without operations don't sustain quality; operations without methods can't make principled improvements.
The completeness question. Six volumes is enough for most teams. The remaining two planned volumes (UX, Platforms Survey) are valuable but less foundational. UX patterns matter, but most teams have UX expertise distinct from search engineering; the search team's contribution is the search-specific UX implications, which can be learned from existing UX literature. Platforms Survey matters for teams choosing platforms or considering migrations, but most production teams are settled on their platform and need depth in that platform rather than comparison across platforms. The core working library is six volumes; Vols 7 and 8 are domain extensions.
Reading order for new practitioners. The recommended order for a practitioner new to search engineering: Volume 1 for architectural vocabulary; Volume 5 for measurement discipline; Volume 6 for operational practice; then Volumes 2, 3, 4 for the technical disciplines as needed for specific projects. The order grounds in the framing (Vol 1), the way to evaluate progress (Vol 5), and the daily practice (Vol 6) before specializing into specific subdisciplines. Experienced practitioners can read any volume standalone.
Consulting application. For practitioners working with clients, the six volumes map to consulting deliverables in a structured way. Initial assessment uses Volume 1 for architecture and Volume 5 for measurement baseline. Investigation uses Volume 6 for query log analysis and root cause methodology. Recommendations span Volumes 2, 3, 4 depending on what the investigation surfaces. Long-term engagement uses Volume 6 to establish operational cadence the client can sustain after the engagement ends. The library structure mirrors how search consulting actually works — across the disciplines, anchored in operational practice.
Appendix D — Discovery and Standards
Resources for tracking operations discipline (consolidated from Section H):
- Foundational texts: Kohavi, Tang, Xu, Trustworthy Online Controlled Experiments (Cambridge, 2020); Google SRE book + Workbook (free online); Kleppmann, Designing Data-Intensive Applications (O'Reilly, 2017); Grainger, AI-Powered Search (Manning, 2024).
- Search-specific writing: Daniel Tunkelang on operational practice; OpenSource Connections; search team blogs at Etsy, Wayfair, Spotify.
- Industry venues: Haystack Conference, Berlin Buzzwords.
- SRE and observability resources: USENIX SREcon, observability vendor blogs (Datadog, Honeycomb).
- Data engineering resources: Kleppmann; modern data stack blogs (dbt, Airflow, Fivetran).
- Tools and platforms: A/B testing (Optimizely, LaunchDarkly, GrowthBook); observability (Datadog, Honeycomb, Grafana+Prometheus); data warehouses (BigQuery, Snowflake, Redshift, ClickHouse).
- Communities: Relevancy Engineering Slack; SRE communities; data engineering communities.
Three practical recommendations. First, the Google SRE book is short and immediately applicable; reading the chapters on monitoring, alerting, and incident response pays off quickly for any search team. Second, the Kohavi et al. A/B testing book is the single most important investment for teams shipping search changes; the methodology errors it documents are widespread, and avoiding them saves teams from many false conclusions. Third, building query log analytics infrastructure is foundational; teams that skip this and try to operate on intuition consistently underperform teams that have invested in proper log analytics, regardless of technical sophistication elsewhere.
Appendix E — Omissions
This catalog covers about 9 patterns across 8 sections — the operational core. The wider operations discipline includes much that isn't covered here:
- Incident response in depth (severity definitions, communication patterns, on-call rotations, runbook construction). SRE-adjacent topic; SRE literature covers extensively.
- Postmortem methodology in depth (blameless postmortems, action item tracking, organizational learning). SRE topic; covered well in SRE literature.
- Capacity planning for search infrastructure (cluster sizing, growth projection, cost modeling). Engineering/infrastructure topic; vendor documentation covers.
- Data quality monitoring beyond search (catalog data quality, content metadata quality, source-of-truth synchronization). Data engineering topic.
- Privacy operations (data retention enforcement, deletion request handling, anonymization audits). Privacy/legal topic with operational implications.
- Cost monitoring and optimization (search infrastructure cost attribution, LLM API cost tracking, embedding cost management). FinOps topic.
- Multi-region operations (consistency, replication lag monitoring, failover). Infrastructure topic.
- ML model lifecycle operations (model versioning, drift monitoring, retraining cadence). MLOps topic with search-specific applications.
- LLM-specific operational concerns (prompt versioning, hallucination monitoring, output safety, model deprecations). Emerging area through 2024–2026.
- Search-specific compliance (accessibility for search UX, fairness in ranking, regulatory reporting). Compliance topic with operational implications.
Appendix F — The Integrative Practice
Volume 6 occupies a structurally different position in the series than Volumes 1–5. The earlier volumes each cover one technical discipline; this volume covers the practice that integrates them. The position matters because it shapes how the volume should be read and used.
Why operations earns a separate volume. The operational discipline is substantial enough — with its own patterns, its own infrastructure requirements, its own methodology — to warrant separate treatment. Folding operations into the technical volumes would either over-burden them with practice-specific detail or under-serve operations by treating it as an afterthought. Either failure mode produces poor reference material. The separate volume gives operations the space it needs.
How the volume should be read. The technical volumes can be read for their methods; operations should be read for the practice of applying them. The patterns documented here aren't algorithmic recipes; they're methodological structures that practitioners adapt to their specific workload. The zero-result investigation cycle (Section B) looks different in different organizations — the diagnostic questions are universal but the specific implementations vary. The A/B testing methodology (Section F) is universal but the team's testing cadence, ramp speeds, and analysis tools are organization-specific. The reading discipline is extracting the methodology from the specific examples.
How the volume integrates with consulting practice. Operations is what most search consulting engagements are really about. Clients rarely need help understanding what BM25 is; they need help establishing the cadence that finds and fixes their specific problems sustainably. The patterns in this volume — query log analytics, weekly investigation cycles, A/B testing discipline, regression alerting — are deliverables that consulting engagements often produce. Volume 6 as reference material structures these engagements; the client can keep the reference after the engagement ends and continue applying the patterns.
The natural next volume. With Volume 6 delivered, the strongest next candidate is Volume 7 (Search UX Patterns) — the presentation layer that the operational work ultimately affects. The investigation methodology (Sections B and C) frequently surfaces UX-side issues (snippets that don't communicate relevance, facets that overwhelm or underwhelm, autocomplete that suggests poorly); Volume 7 would document the UX patterns for fixing these. Alternative: Volume 8 (Platforms Survey) for clients choosing or migrating between platforms. Both volumes round out the series; Volume 6 was the more foundational gap, and it's now closed.
The series' maturity. Six volumes is more than the catalog needs to be useful; it's where the series stops being aspirational and becomes a working library. The first volume needs companions to be useful; the third or fourth volume adds incremental value; by the sixth volume, the library is comprehensive enough to support most production search engineering practice. The remaining volumes (7, 8, and any future additions) extend rather than complete; the practitioner now has enough.
— End of The Search Operations Catalog (Volume 6) —
— Volume 6 of the Search Engineering Series —